The New PSAT Score Curve

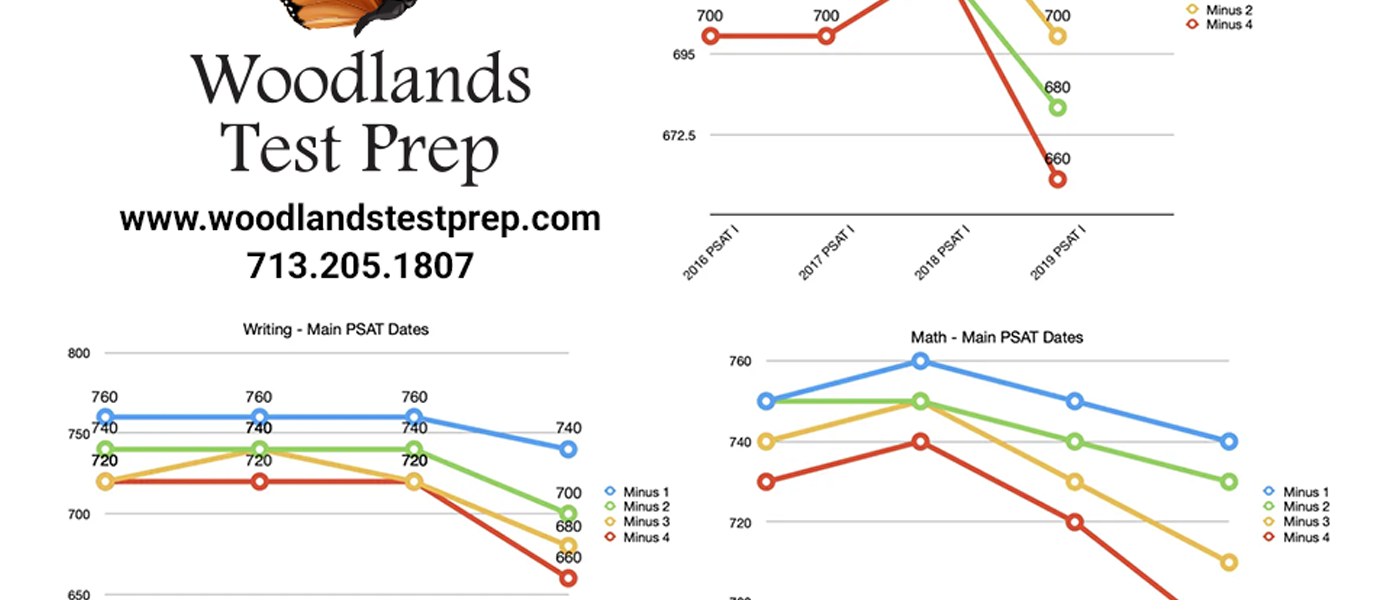
After the return of the PSAT results last week, the reports of lower than anticipated scores began pouring in. We’ve spent some time analyzing this year’s PSAT scale in relation to the last three years to see how different this year’s scale truly is. Our conclusion: it’s definitely different.
The charts below show the scaled scores resulting from missing one, two, three, or four questions on each section (Reading, Writing, and Math) for each of the years 2016 through 2019. For the sake of simplicity, the Reading and Writing scores have been expressed on the more familiar 160 – 760 scale. When looking at *just* the main PSAT dates (on which 80 – 90% of students actually take the test), the evidence is stark: each missed question carries a larger penalty in 2019. For students at the very top of the scale (and hoping for National Merit Semifinalist), the steeper curves raise the stakes on a test that was already high stakes. Given the scales, it is possible that the cutoff for Texas may come down this year, having held steady at 221 for the years represented by these graphs.
We will stay on top of these changes as more information comes to light.
From the Author
